Wi-Fi signal strength: Are your investments in wireless infrastructure based on shaky data?
To check our Wi-Fi signal reception, we tend to look at the signal notification icon of our devices: the more bars, the better the signal. But more often than not, the amount of bars doesn’t give us a good indication of the quality of our connection.
We’ve all had situations where 4 or more bars are lighting up, but websites are still loading agonizingly slow. To make things worse, a lot of professional Wi-Fi planning and comparison tools use this same signal strength metric as a substitute for Wi-Fi throughput!
This blog post will show that the Received Signal Strength Indication or RSSI of a link (which is basically a numeric value for the number of bars) doesn’t correlate well with the throughput that can be achieved on that link.
In other words, big investment decisions in Wi-Fi infrastructure turn out to be based on paltry data at best.
RSSI
RSSI is a measurement of the amount of power in a received radio signal. This signal can be Wi-Fi, a mobile network connection or any other wireless protocol. Wi-Fi devices continuously measure the amount of power carried by incoming traffic and report it back to the operating system of the device. This information is then used to give the user some knowledge about the Wi-Fi signal quality in the form of the well known signal bars.
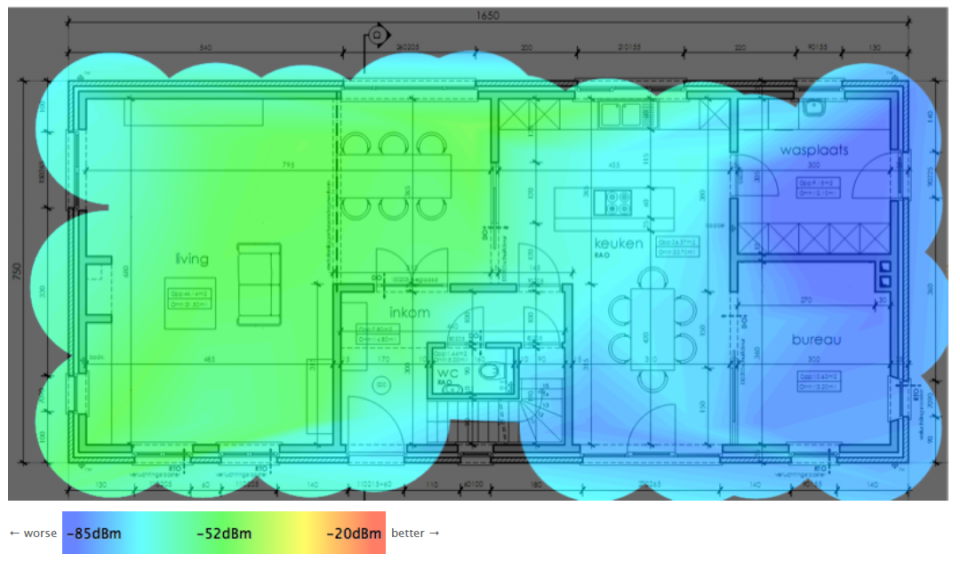
Most Wi-Fi access points (or APs) even register RSSI values of all their connected client devices and a lot of popular Wi-Fi planning tools (like Ekahau, NetSpot, TamoGraph and AirMagnet Survey Express) use this signal strength measurements to create heatmaps and predict Wi-Fi coverage and throughput.
Link Speed
Since Wi-Fi operates in a rapidly changing wireless environment, it is highly dynamic in nature. Wi-Fi transmitters constantly adjust their traffic modulation in response to varying conditions, such as changes in attenuation or interference levels. While ‘full-duplex gigabit ethernet‘ may accurately describe the real-life performance of a wired link, the performance of a single Wi-Fi link may change from 1 Gbps to 1 Mbps and back within a matter of seconds.
As long as the chosen modulation is based on the received signal quality, RSSI should still be a good metric for performance, right? True, but there seems to be a lot more to the story!
First of all, RSSI is pure receive-side metric, while modulation happens at the transmitting side. To use the RSSI at one side of a link as a metric for the throughput of that link, means assuming the Wi-Fi link is symmetrical. Until we start using Wi-Fi access points as smartphones, this is not very likely. While current access points often have three antennas sending at the maximum allowed power, many mobile devices are limited to one antenna and limit their output strength on purpose to save battery energy.
Furthermore, just how and when to switch between different modulations varies between Wi-Fi chipsets. For example, if a transmitted packet is not acknowledged, some Wi-Fi devices immediately fall back to a lower modulation while others will try to retransmit at the same modulation (and only fall back after some retries).
All this makes the relationship between RSSI and link throughput a lot less predictable!
Reality Check
At Excentis, we perform a lot of Wi-Fi throughput testing. In such tests we measure the real application–layer throughput on a fixed set of locations within a house environment. These locations are chosen in such a way that the complete RSSI scale (-90 dBm up to -25 dBm) is generally covered. Since we store both the actual throughput result and the RSSI value for each measurement, we can easily correlate the two.
The picture below shows data from such a test. The data points show the RSSI values and throughput results for a single Wi-Fi client device on multiple locations. Multiple access points (all with similar characteristics) are plotted.
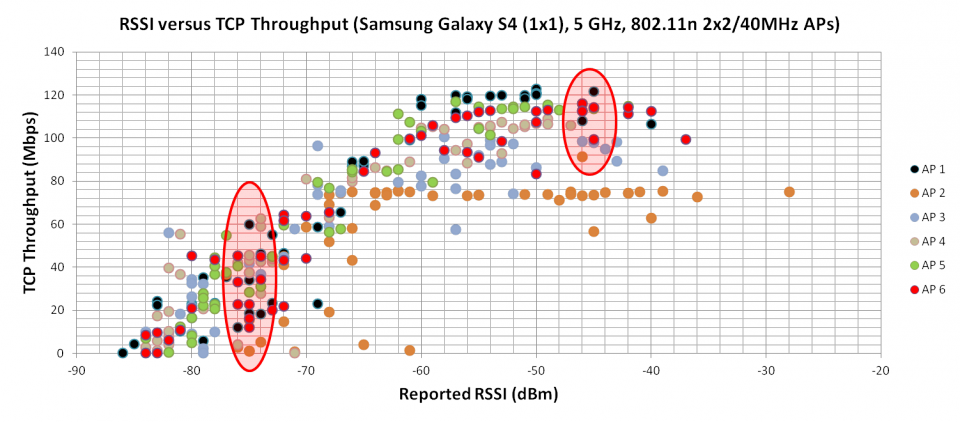
At first glance, there seems to be a clear correlation between RSSI and throughput: the higher the RSSI, the higher the throughput. This is definitely true. However, does this also mean we can predict the throughput based on the RSSI? In other words, can we assess the actual performance of an access point based on the reported RSSI values, like many tools do?
Unfortunately, this is not the case. The graph clearly shows that a single RSSI value can result in a wide range of throughput measurements, even for the same access point! For example, it turns out an RSSI value around -75 dBm on AP6 can result in anything between 5 Mbps and 45 Mbps. Not really what we were hoping for…
Of course, the spread in throughput is widest for low RSSI values where the connection is less reliable. But even at higher RSSI values (around -45 dBm), we still see a spread of 30 Mbps! This margin of error may be well above the performance difference between comparable access points, which renders RSSI values useless for such purposes.
Conclusion: Embracing Wi-Fi Complexity
Receive Signal Strength Indicator values have many advantages, like being easy to measure and easy to interpret. Signal strength also has an influence on the link performance. However, it doesn’t take account of the complexities of Wi-Fi operation at both the physical and MAC layers, which influence Wi-Fi performance just as much!
Using RSSI values to predict link performance means you’re ignoring rather than acknowledging the complexity of Wi-Fi and may lead to skewed or even wrong conclusions.


Jan, thank you for this!!! There are so many people that assume Full Bars = great throughput. There are many other factors that go unnoticed as well i.e. Since WiFi is a shared medium and uses collision avoidance we often find our throughput to be slow in dense environments.
Placing an 802.11a client or even an 802.11n client on an 802.11ac radio will slow your expected performance due to their slower performance. People will also put multiple SSIDs on the same VLAN not knowing that they are creating additional noise in the air.
Thank you for educating the masses…
Keith Mackinen
Xirrus
On the phy layer, RSSI indicates the coverage area. RSSI together with SNR indicate what type of modulation used, henceforth determine the achievable data throughput.
sir,
can u please provide me details with how rssi affect energy consumption on smartphones while downloading large files and calculation of rssi on smartphones
Hi ammu, thank you for your question but we don’t have that information available.
Pl. send me signal table like dbm to mbps from -20 to -94dbm immediately.