Lag or bad aim in Counter-Strike? QED: Quality of Experience Delivered
When testing network devices, all that really matters is:
Will the device be capable of delivering a good experience to the end user?
Will you be able to play your best game of Counter-Strike, uninhibited by any network related issue?
And did you lose that game because of lag? Or was the network not the problem after all?
Our products and testing services focus more and more on these key performance indicators, rather than merely focusing on metrics like raw throughput and latency of individual packets.
Introducing Quality of Experience Delivered or QED testing
With our new QED testing, in close cooperation with Domos, we can specify pass/fail criteria for a test. When a test passes, we can rest assured that the devices under test can make the end user happy. Lag or bad aim? We have the data 😉
Over the recent years, our testing methods evolved to arrive at the current new QED approach.
Level 1: Basic latency measurements
Many years ago, we introduced latency measurements into our ByteBlower network traffic generator/analyzer.
The reports show latency metric per flow:
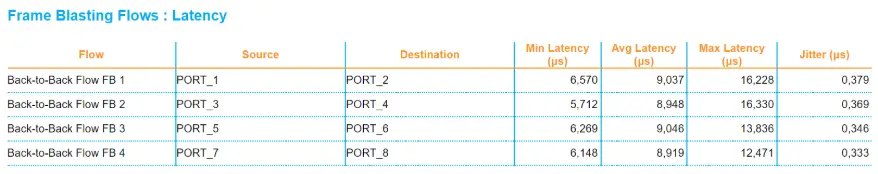
This was a huge leap forward.
At that point, we were able to show the minimum, average, maximum latency. The jitter indicated how stable the latency was.
Level 2: Latency results over time
The basic latency measurements were nice but gave no information about how latency evolved during the test.
That is why we introduced latency results over time.
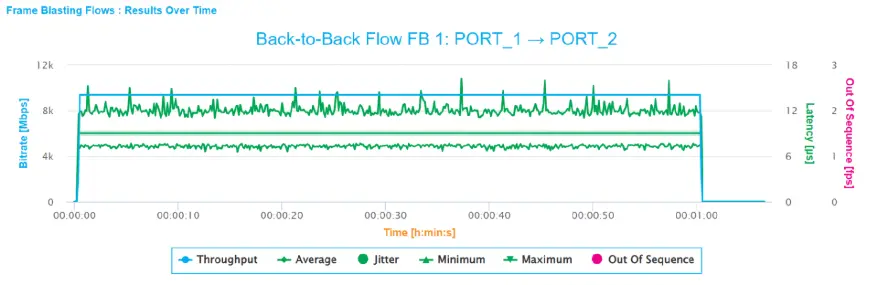
Once again, our overview and especially insights on network latency grew significantly!
Level Advanced: Latency histograms
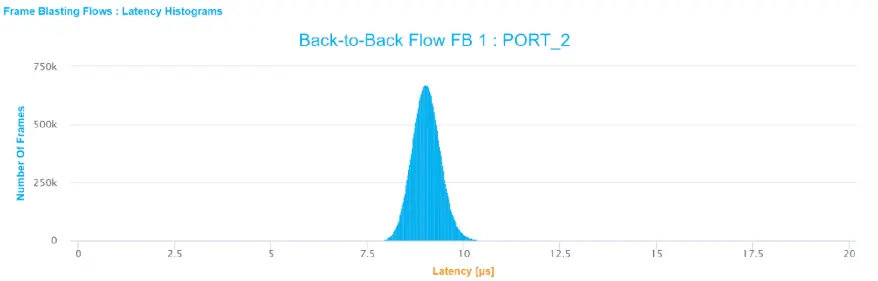
With latency histograms, it became possible to see at once how one flow’s latency was distributed.
Level Expert: CCDF and CDF graphs
A small portion of all transmitted packets may have terrible latencies or even get lost. Luckily, most applications contain built-in robustness mechanisms to make them resilient against this kind of issue. Such applications work fine even when a packet gets lost here and there. Latency CCDF and CDF graphs allowed us to verify this.
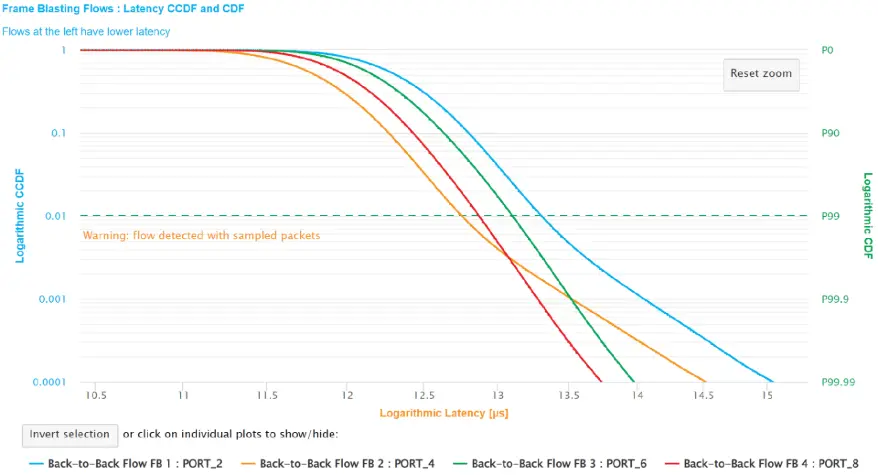
On this graph, you can see the percentage of received traffic, and the corresponding maximum latency. Here you can see that 90% of all traffic was received within 13ms.
These graphs also made it very easy to compare different flows. Flows on the left have the lowest latency.
Boss Level: QED
Latency CCDF graphs are a powerful tool. We can learn a lot by looking at one such graph. But still there are difficulties.
Would all be well if 99.9% of the network traffic arrives within 1ms?
Not necessarily!
Imagine that you were gaming for 1 hour. In the background packets are transmitted downstream and upstream at a steady rate. This means that during 0.1% of the time, that is 3.6 seconds, the latency could have been much higher than 1ms, like 100ms or even more. The packets may even be lost!
The worst-case scenario would be if all “bad” packets were sent out consecutively. In that case, the gamer who just reached the finals of the e-games world cup would be frozen during 3.6 seconds, resulting in being shot dead, and a very frustrating experience.
To prevent this kind of issue, we’re introducing latency histograms over time in our API. Now we cóuld generate a histogram for every second of testing. But we won’t! Such a big heap of graphs would be very difficult to interpret.
To facilitate the interpretation of these measurements, we generate one new graph, showing a couple of percentiles that we are interested in:
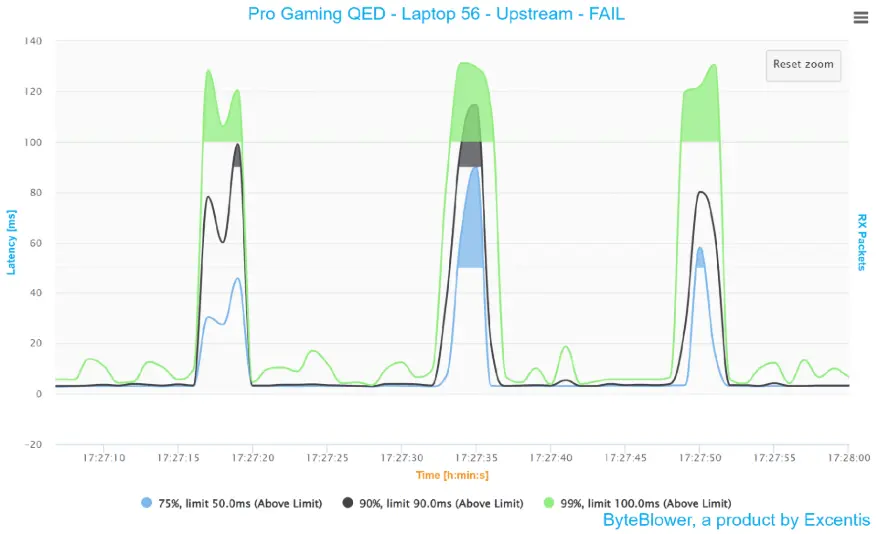
For each percentile we can specify a maximum allowed latency limit. Latency zones beyond that limit are marked in a solid color. This automatically results in a test failure.
When there are no exceeded limits, we can guarantee an optimal experience during the entire game.
On our GitHub page, we provide an example script that demonstrates how you can run such tests yourself! We also provide example results.
Endgame?
The story does not end here.
The binary Pass/Fail approach above is sometimes too coarse. If the result is a failure, we want to know quickly how bad it really was. If it was a pass, how much margin do we have? And what if we want to compare flows? This will become possible with Quality of Outcome (QoO).
By specifying a low and a high latency margin per percentile, it becomes possible to calculate how far you’re away from disaster (0% QoO) or perfection (100% QoO).
An RFC about QoO is being prepared for publication.
But even this won’t be the final word. New obstacles will pop up, and we will overcome them!
In this article, we focused on gaming. We also test video conferencing, video streaming and web browsing, using realistic traffic patterns.
Level up: Integrate QED tests in your network!
Integrating QED tests in your network can significantly increase user satisfaction, provide your business with a big extra USP, ánd reduce troubleshoot costs.