How to create a dashboard for traffic tests
UPDATE: On our Github-account ( https://github.com/excentis/ByteBlower_dashboard2 ) you can find the dashboard code of this blogpost rewritten in nodejs and python. Following blogpost explains how you can create an another simple dashboard using our ByteBlower Python API.
At Excentis, executing performance measurements and stability tests is a daily job. Of course we use our own ByteBlower to do this job. Because this kind of testing uses fully automated processes that interacts with other systems as well (like our provisioning servers), we use scripting via the ByteBlower Tcl API to integrate ByteBlower into these processes.
The ByteBlower GUI gives us all the reporting features we need and has a real-time view to monitor the test progress. But since we’re using the Tcl API instead of the GUI here, we also need to solve the reporting and monitoring from within the test script. Or alongside of it, as we will see…
Monitoring test progress, the “old” way
Next to automating the tests themselves, we also need a way to represent the results and monitor the progress of a test script (since we’re not using the GUI, remember?). A first and often used approach is to use a log file and append the results to the end of the file. It could output lines of text like this:
[date : time : TX packets 10000 RX packets 9998000]
But that’s not so readable of course. Having graphs is much easier. Who can’t remember amazing ASCII graphs like this one:
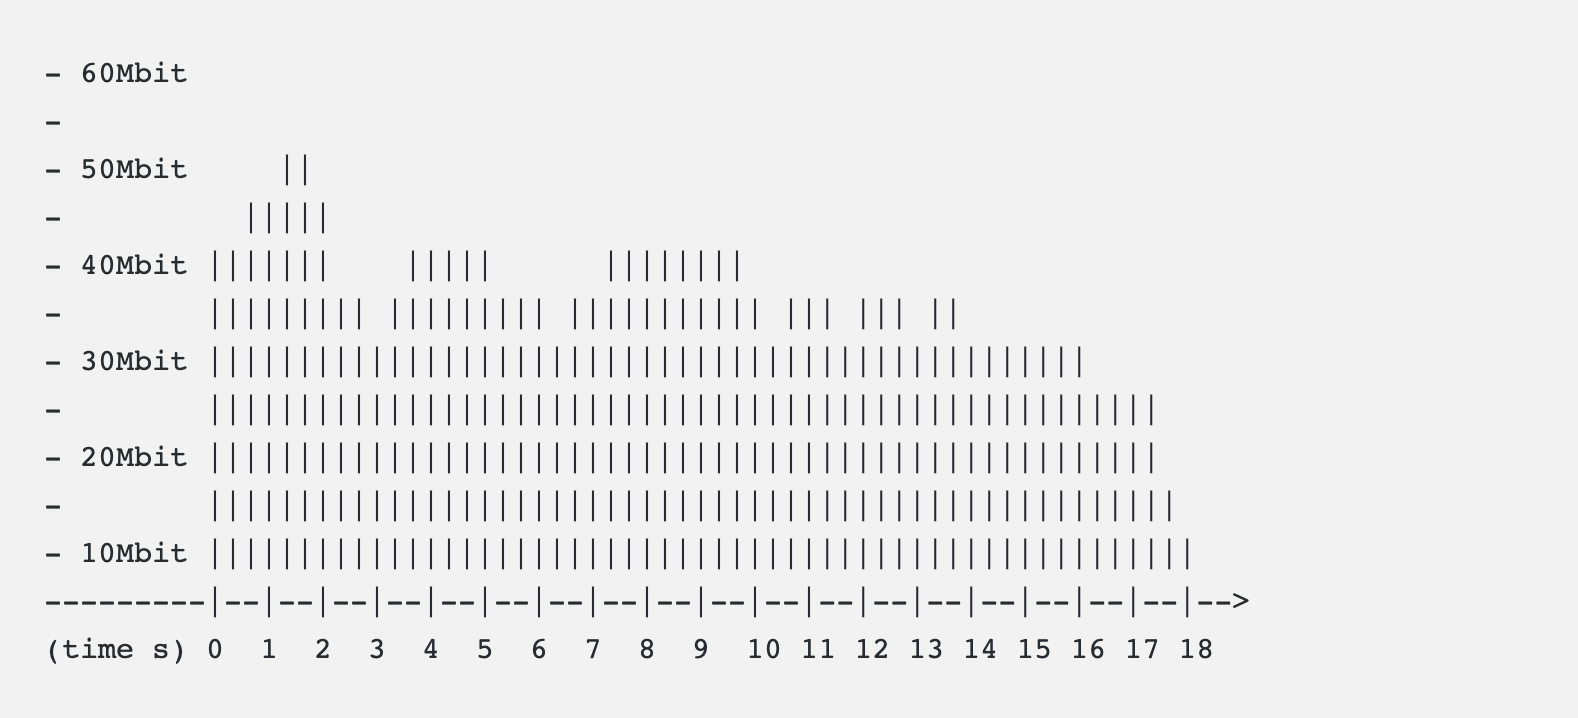
We could write such graphs to the log file or the console or both. But, with minimal effort, things can get much more fancy and fun. Today we will discuss one of our favorite visualization tools called Dashing. We use it for real-time progress visualization and monitoring, not for final reporting.
Monitoring test progress, the “modern” way
Dashing is a framework created at Shopify that lets you build beautiful dashboards. It comes with some custom widgets and many extensions exist. Dashing is written in Ruby, using HTML, CoffeeScript and SCSS. So, to render your dashboard you only need a web browser.
We won’t go into details of installing Dashing, there are plenty of how-to’s available on the net like the one on dashing.io. We will focus on how to get data from your test towards your dashboard.
Let’s assume we have a basic test between two ports. We’re sending traffic in both directions. Our goal is to create a dashboard that looks like this:
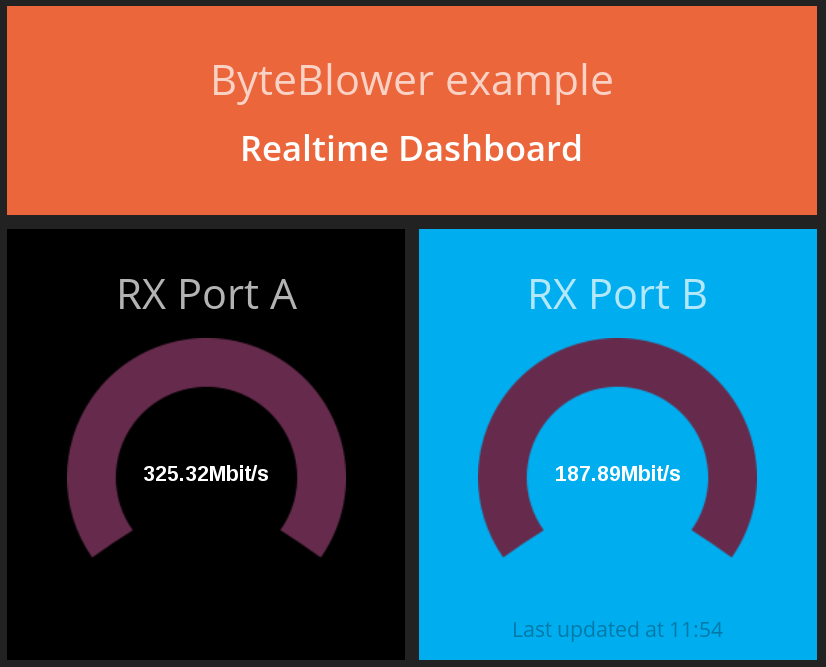
Of course, we want to have some real numbers in the gauges. To do this, we must send data (with HTTP POST) towards our dashboard. This is done through a Tcl script.
One of the great things about the ByteBlower API is the ability to monitor traffic on a physical interface, in parallel with and independent of any running tests. This allows us to monitor the traffic and display it on the dashboard, while running the test itself from another Tcl interpreter or even the ByteBlower GUI!
Getting incoming results on a ByteBlower port is as easy as this:
(1) Create the port counters
set serverObj [ ByteBlower Server.Add $serverAddress ]
set portObjA [ $serverObj Port.Create $portA ]
set portACounterObj [ $portObjA Result.History.Get ]
(2) Get the result of the latest interval (in bytes)
$counterObj Refresh
[ [ $counterObj Interval.Latest.Get ] Rx.All.Get ] ByteCount.Get
This can now be converted to whatever speed unit you want. In our example, we converted this to bits per second.
A last step is updating the gauge on the dashboard. The gauge can be updated directly over HTTP: just POST the data you want in JSON format to /widgets/widget_id. For security, you will also have to include your auth_token. An example:
curl -d '{ "auth_token": "YOUR_AUTH_TOKEN", "status": 100000 }' http://yourserver:8080/widgets/portA
A full listing of both the dashboard and the Tcl script is available for download here:
byteblower-dashing-example.zip
byteblower-dashing-example.zip
Now that you have your first dashboard, you’re ready for more complex dashboards like this one:
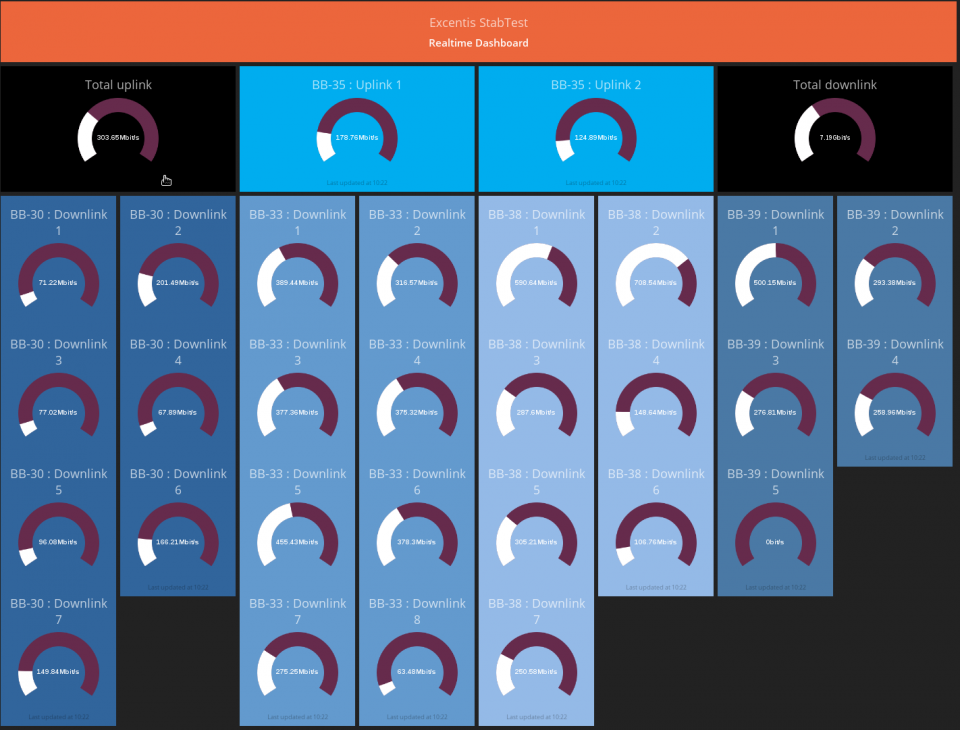
Even if you’re running tests from within the ByteBlower GUI that already has a real-time view, the kind of customizable real-time visualization you can get with Dashing is a useful addition to your test environment.
Have fun with your online ByteBlower dashboards!